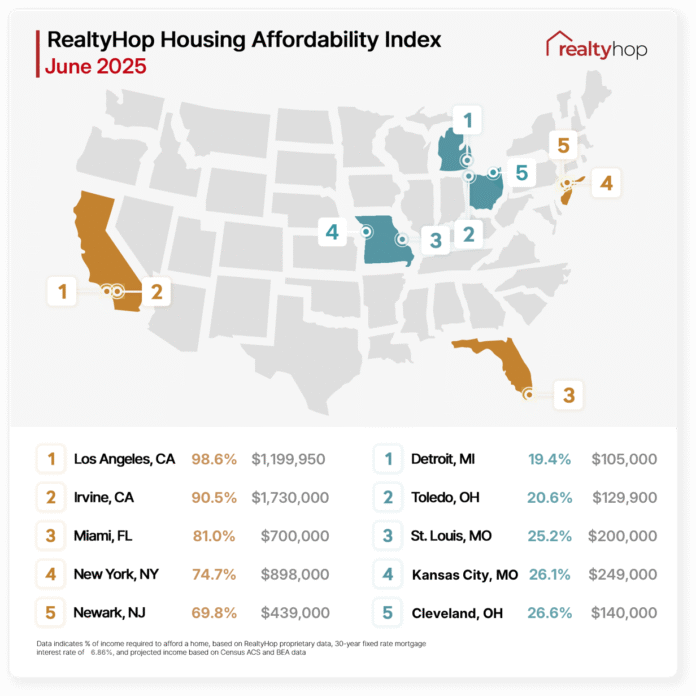
In this June 2025 edition of the Housing Affordability Index, we examine what American households across the 100 largest cities need to spend on housing to find out:
Is homeownership affordable or possible for the average American family?
The nationwide housing market remains daunting to prospective buyers. As housing prices remain high, many major cities saw listing prices increase this month. With interest rates also above 6.8%, prospective buyers may wonder if this is the ideal time to purchase a property. Those on the fence about buying should consult with their local real estate expert to learn more about their specific market. There are still some cities where homeowners spend less than the recommended 30% of their income on housing.
Key Findings
- Homebuyers in 81 out of the 100 major cities we analyzed would have to spend over 30% of their annual income on homeownership – that’s one more than last month.
- In the 25 most unaffordable housing markets nationwide, homeowners spend at least 46% of their income on homeownership costs.
- California remains unaffordable for average Americans. Seven of the ten least affordable markets are in California.
- Four of the least affordable housing markets — Los Angeles, CA, Irvine, CA, New York, NY, and Newark, NJ — became less affordable this month.
- The median home price increased in all five of the most affordable housing markets: Detroit, MI, Toledo, OH, St. Louis, MO, Kansas City, MO, and Cleveland, OH.
The 5 Least Affordable Housing Markets
1. Los Angeles, CA
Los Angeles remains the country’s least affordable housing market. The median list price increased yet again, and families can expect to spend $6,932.58 monthly on homeownership costs – that’s 98.56% of their income.
2. Irvine, CA
Irvine is still the second least affordable housing market. Households with a median income of $136,160 can expect to direct 90.48% of it toward their monthly mortgage payments and property taxes.
3. Miami, FL
Miami is the third least affordable housing market this month. The median list price decreased to $700,000, and households can expect to spend $4,210.33 monthly on the costs of homeownership.
4. New York, NY
New York City remained the fourth least affordable housing market. Households with a median income of $83,717 can expect to direct 74.74% of it toward a home with a median list price of $898,000.
5. Newark, NJ
Newark held onto its spot as the fifth least affordable housing market. The median list price decreased slightly to $439,000, and households will spend 69.80% of their monthly income on housing costs.
The 5 Most Affordable Housing Markets
1. Detroit, MI
Detroit remains the most affordable housing market in the nation. The median list price remained at $105,000, and households can expect to spend $672.66 monthly on their mortgage payments and property taxes.
2. Toledo, OH
Toledo held onto its spot as the second most affordable housing market. This month, the median list price increased to $129,900, and households can expect to spend 20.57% of their income on the costs of homeownership.
3. St. Louis, MO
St. Louis is the third most affordable housing market this month. Households with a median income of $58,056 can expect to spend $1,219.80 on their monthly housing expenses.
4. Kansas City, MO
Kansas City remained the fourth most affordable housing market. The median list price increased to $249,000, and households can now expect to spend $1,541.56 monthly on mortgage payments and property taxes.
5. Cleveland, OH
Cleveland is still the fifth most affordable housing market this month. Households with a median income of $41,155 will direct 26.60% of it toward housing costs each month.
Housing Markets to Watch
The following housing markets witnessed significant changes in June 2025.
Boise, ID
Boise jumped five spots in the rankings to become the 26th least affordable housing market this month. The median list price increased by 5.59% to $564,900, and households can now expect to spend 46.13% of their income on housing.
Fort Wayne, IN
Fort Wayne became more affordable for prospective buyers this month, dropping to the 93rd spot in our ranking. Households with a median income of $63,322 can expect to spend $1,487.73 monthly on mortgage payments and property taxes.
Anchorage, AK
Anchorage homebuyers can expect to spend more money this month on housing. The median list price increased $410,000, and the city moved six spots in the rankings to become the 85th least affordable housing market.
Methodology
The RealtyHop Housing Affordability Index: June 2025 analyzes proprietary and ACS Census data to provide an index of housing affordability and homeownership burden across the 100 most populous cities in the country. Median home prices are calculated using over 800,000 listings in the RealtyHop database over the month before publication.
To calculate the index, the following statistics are used:
1) Projected median household income.
2) Median for-sale home listing prices via RealtyHop data
3) Local property taxes via ACS Census data
4) Mortgage expenses, assuming a 30-year mortgage, a 6.86% mortgage interest rate based on reported weekly averages in the past four weeks, and a 20% down payment.
See below for previous RealtyHop Housing Affordability Studies:
- RealtyHop Housing Affordability Index: May 2025
- RealtyHop Housing Affordability Index: April 2025
- RealtyHop Housing Affordability Index: March 2025
Full Data for June 2025
The post RealtyHop Housing Affordability Index: June 2025 appeared first on RealtyHop Blog.


