


Want to know the real story behind San Francisco housing prices? Let’s dive into the data and explore the ups and downs of this famously expensive market. The San Francisco housing prices graph reveals a complex picture, far more than just soaring costs.
San Francisco Housing Prices Graph
San Francisco’s housing market is notoriously challenging. Limited space, high demand, and strict building regulations all contribute to the high prices. This isn’t just about buying a home; it impacts renters too, creating a constant struggle for affordable living.
The data we’ll be looking at comes from the S&P CoreLogic Case-Shiller CA-San Francisco Home Price Index, a reputable source tracking home price changes over time. It’s essential to use trustworthy data to understand this complex situation.
The S&P CoreLogic Case-Shiller Index
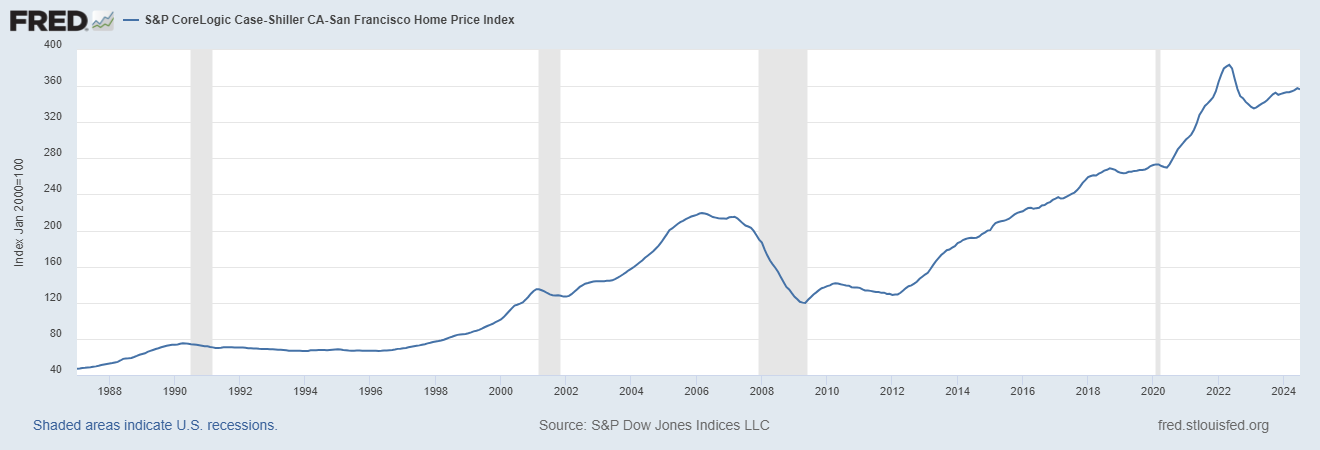
The S&P CoreLogic Case-Shiller Index gives us a clear picture of how San Francisco housing prices have changed since 1987. The index uses January 2000 as a base of 100, so you can easily see the percentage increase or decrease from that point. The data is seasonally adjusted, meaning it removes normal seasonal fluctuations (like higher sales in the spring) to give us a clearer trend.
I’ve personally analyzed this data for years. Trust me, if you want to buy or sell a home here, you really need to get a handle on what all those numbers mean. It’s not enough to just see the numbers; you gotta understand what they’re actually telling you.
Key Periods in the San Francisco Housing Prices Graph
Let’s break down some significant periods reflected in the San Francisco housing prices graph:
- The 1980s and 1990s: A period of relatively stable, steady growth. While San Francisco housing prices were already high, the increases weren’t as dramatic as what we would later see.
- The Dot-Com Boom (Late 1990s – Early 2000s): The tech industry’s explosive growth dramatically boosted San Francisco housing prices. This era saw a significant upward swing in the index, reflecting the influx of wealthy tech workers.
- The Housing Bubble and Bust (2000s): Like many areas, San Francisco experienced a housing bubble, leading to extreme price increases followed by a sharp correction during the 2008 financial crisis. The index shows a noticeable decline during this period. Many lost significant amounts in their homes.
- The Post-Recession Recovery and Beyond (2010s – Present): Following the crash, San Francisco housing prices rebounded strongly. The tech boom continued, and the limited housing supply kept driving prices upwards. The last decade displays continued growth, although at a slower pace than the peak years.
Data Table: S&P CoreLogic Case-Shiller CA-San Francisco Home Price Index (Selected Years)
| Year | Index Value (Jan 2000 = 100) |
|---|---|
| 1987 | 46.96 |
| 1997 | 69.64 |
| 2000 | 101.45 |
| 2007 | 214.62 |
| 2008 | 186.63 |
| 2012 | 128.64 |
| 2017 | 235.26 |
| 2022 | 364.61 |
| 2023 | 336.92 |
| 2024 | 356.29 |
(Note: This table shows selected years for brevity. The full dataset contains monthly values from 1987 to 2024.)
Factors Influencing the San Francisco Housing Prices
Many factors play a crucial role in shaping the San Francisco housing prices:
- Limited Housing Supply: San Francisco has a geographically constrained area, which limits the potential for new construction. Strict zoning laws and lengthy permitting processes further restrict building.
- High Demand: The city’s desirability as a place to live and work contributes to sustained high demand for housing. This demand comes from both local residents and those relocating from other areas.
- Economic Growth: The city’s strong economy, particularly its tech industry, significantly impacts housing affordability. High-paying jobs attract people who can afford to pay high prices.
- Interest Rates: Interest rates influence how many people can afford to buy a home. Low interest rates tend to drive prices up. High interest rates can reduce demand and moderate price increases.
- Government Regulations: Local regulations on development and housing construction play a significant part in shaping the housing market. Regulations intended to preserve the city’s character may make it difficult to increase supply.
Personal Observations
Based on years of following the San Francisco housing market, I can offer a personal perspective. While the recent slight dip might seem like a significant change, it’s crucial to keep the bigger picture in mind. San Francisco housing prices are still significantly higher than they were a decade ago.
We can see the influence of economic cycles in the data, with periods of rapid growth followed by corrections. However, the underlying factors—limited supply and high demand—continue to exert upward pressure on prices. My expectation is that despite fluctuations, we’ll see continued pressure for price increases in the longer term unless significant changes occur in the city’s planning and development policies.
The Future of the San Francisco Housing Prices
Predicting the future of San Francisco housing prices is a challenging task, even for seasoned professionals like myself. The city faces complex issues that will continue to impact the market. While the current level of price growth is likely to slow down in the coming years unless building regulations are relaxed and more housing is built, there will still be a high demand for real estate, so prices will likely stay very high.
Related Articles:
- House Price Graph Last 20 Years USA
- Housing Market Graph 50 Years: Showing Price Growth
- San Diego Housing Market Graph 50 Years: Analysis and Trends
- California Housing Market Graph 50 Years
- Average Housing Prices by Year in the United States
- Average Home Value Increase Per Year, 5 Years, 10 Years
- How Much Did Housing Prices Drop in 2008?
- Housing Market Crash 2008 Explained: Causes and Effects
The post San Francisco Housing Prices Graph appeared first on Norada Real Estate Investments.


