


National Airbnb occupancy dropped from 57% in 2024 to roughly 50% by early 2026. If you stopped reading right there and assumed the short-term rental opportunity is drying up, you’d be making the same mistake a lot of investors made this year. Average daily rates are still climbing. Demand is still growing faster than hotel demand. The problem isn’t the industry. It’s that the old approach of “pick a popular city and buy something” doesn’t work anymore in a market that’s sorting winners from losers this fast.
Austin added over 2,500 new Airbnb listings in a single year and watched its occupancy fall to 45%. Meanwhile, Gatlinburg’s listings grew even faster and its revenue per available night barely moved. Same country, same general strategy, two completely different outcomes. The difference wasn’t luck. It was market analysis, or the lack of it.
This guide walks through exactly how to analyze an Airbnb market before you buy in today’s environment, where supply growth and regulation matter as much as tourism numbers.
Key Takeaways
- National Airbnb occupancy has settled around 50%, but average daily rates and revenue per available night are still growing, meaning the correction is about supply distribution, not shrinking demand.
- The cities getting hurt worst in 2026 are the ones where new listings grew fastest, not necessarily the ones with weak tourism. Supply growth rate matters as much as raw demand.
- A complete market analysis checks four things in order: occupancy trend, supply growth, regulatory status, and how the numbers compare against a long-term rental on the same property.
- Start analyzing a market on Mashvisor to pull occupancy, cash-on-cash return, and long-term rental comps for any city or neighborhood in one search.
Step 1: Check the Occupancy Trend, Not Just the Current Number
A single occupancy snapshot tells you almost nothing. What you actually need is the trend over the past 12 to 24 months, because that tells you whether a market is stabilizing, growing, or getting flooded with new listings faster than demand can absorb them.
Mashvisor’s own data shows the national occupancy rate falling from 57% in 2024 to around 50% in spring 2026, driven mainly by new listings outpacing demand growth in popular markets. That’s the national picture. Your job is to find out if your target city is following that pattern or bucking it. Mashvisor’s Airbnb occupancy rate by city breakdown is a good starting point, since it shows how individual markets like Honolulu and Ocean City sit on completely opposite ends of that range even though they’re both established vacation destinations.
Anything sitting at or above 55% occupancy is generally considered healthy in 2026. Below that, you’re not automatically looking at a bad market, but you need to understand why the number is where it is before you buy.
Step 2: Measure Supply Growth Against Demand Growth
This is the step most investors skip, and it’s the one that separates a market like Austin from a market like Gatlinburg in 2026. Austin’s Airbnb listings grew roughly 32% in a single year, and occupancy compressed to around 45% as a result. Gatlinburg’s listings grew even faster, close to 45%, but revenue per available night barely budged because demand grew right alongside it.
The lesson is that raw listing growth isn’t a red flag by itself. It’s a red flag when it outpaces demand. Nationally, supply growth is projected to land around 4.6% in 2026, a big step down from the 20%-plus growth years of 2021 and 2022, but individual cities can run far hotter or cooler than that number. If a market’s active listing count has grown 25%+ in the past year while its occupancy has dropped, you’re looking at a market where new hosts are actively cannibalizing each other’s bookings.
Step 3: Check Average Daily Rate and Revenue, Not Just Occupancy
Occupancy alone can be misleading. A property booked 45% of the year at $300 a night can outearn one booked 70% of the year at $150 a night. That’s why revenue per available night, not occupancy in isolation, is the number that should ultimately drive your buying decision.
The encouraging part of the 2026 data is that even as occupancy has cooled nationally, average daily rates have held up and continued climbing modestly, and short-term rental demand overall grew faster than hotel demand did over the past year. That combination means the properties getting hurt in 2026 tend to be the ones in specific oversupplied submarkets, not the asset class as a whole. When you’re evaluating a property, pull comps for both occupancy and nightly rate, since a market with a lower occupancy number and a strong ADR can still outperform a high-occupancy, low-rate market on a pure revenue basis.
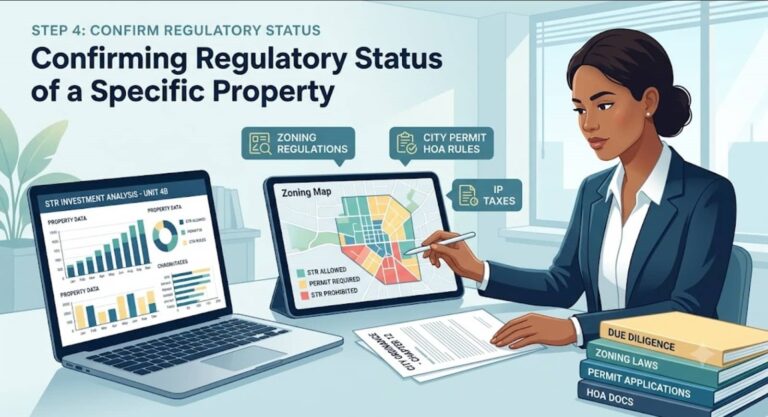
Step 4: Confirm the Regulatory Status of the Specific Property
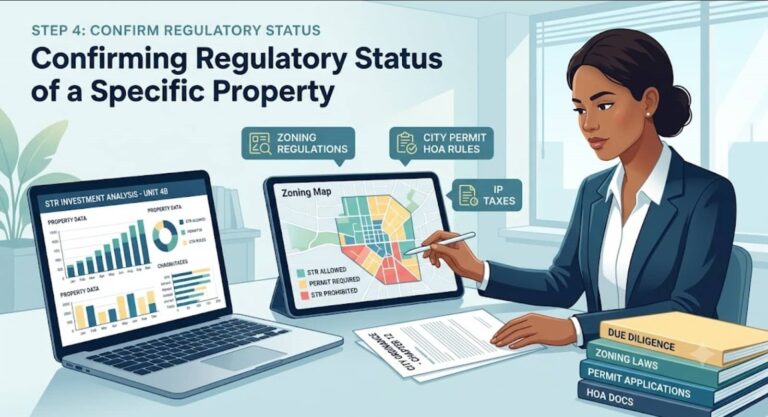
A market can pass every income test and still be a bad investment if the property you’re looking at can’t legally operate as a short-term rental, or is at risk of losing that ability. Regulations changed meaningfully across several US cities in the past two years, from registration requirements in New York to nightly caps in Los Angeles to rising accommodation taxes in Honolulu.
Check the city, county, and any HOA rules that apply to the specific parcel, not just the general reputation of the metro area. A city can be broadly Airbnb-friendly while still restricting certain zoning districts, condo buildings, or neighborhoods entirely. Check current short-term rental regulations before you make an offer, since permit requirements, licensing caps, and occupancy taxes can all shift the return on a property that looks great on paper.
Step 5: Compare the Same Property as a Long-Term Rental
This is the step that separates a market analysis from a real investment decision. Every property you’re evaluating as an Airbnb should also get run as a long-term rental using the same underlying data, because the two strategies can point in opposite directions even in the same neighborhood.
Signals that favor the short-term strategy include strong and stable occupancy trends, a growing ADR, low local rental supply, and a regulatory environment that isn’t actively tightening. Signals that favor the long-term strategy include tight for-sale inventory in the area, rising local rents, strong job growth, and a short-term market that’s showing the kind of oversupply signals covered in Step 2. If you’re seeing a wave of new STR listings hit a submarket faster than demand can absorb, and you’re also seeing steady rent growth and a low vacancy rate on the long-term side, that’s a market telling you which strategy actually has room to perform. Mashvisor pulls both long-term rental comps and Airbnb comps for the same property, which is the only way to make this comparison apples to apples instead of guessing.
Run both scenarios on Mashvisor before you commit to a strategy. A property that looks mediocre as an Airbnb in a softening submarket can still be a strong buy as a long-term rental in the same neighborhood.
Related: How Property Owners Can Decide Between Short-Term And Long-Term Rentals in Today’s Market
Why This Matters More in 2026 Than It Did a Few Years Ago
For most of the post-pandemic boom, almost any Airbnb purchase in a recognizable vacation market performed reasonably well, because demand was growing faster than supply nearly everywhere. That window has closed. Supply growth is still happening, just at a slower and more uneven pace, and the markets that get flooded fastest are the ones where investors skipped steps 2 through 5 above and bought purely on reputation.
This is also why data access has become the real differentiator between hosts who are struggling and hosts who are still growing revenue in a softer occupancy environment. It’s not a coincidence that the investors reporting the strongest 2026 results are the ones running actual market-level analysis before they buy, not the ones relying on which city sounds good.
Where Mashvisor Fits Into This Process
Mashvisor provides the data access you need to confidently complete an Airbnb market analysis. Steps 1 through 5 can be completed quickly and easily on the platform. Start here on our Market Performance dashboard. It contains all of the information you need to do your analysis including:
- Occupancy Rate
- Average Daily Rate
- Average Monthly Revenue
- Average RevPAR
- Active Listings
- New Listings
- Cash on Cash
- Cap Rate
- Historical Occupancy Rate (12 months)
- Historical Revenue (12 months)
- Historical RevPAR (12 months)
- Historical ADR (12 months)
- And more.
All the data is up-to-date and reliable, helping you make the best decisions for your Airbnb business.
Bottom Line
Analyzing an Airbnb market before you buy in 2026 means going past occupancy rate and tourism reputation. Check the occupancy trend, measure supply growth against demand, look at revenue and not just booking frequency, confirm the current regulatory status for the specific property, and run the same address as a long-term rental before you commit. The rental property investment decisions that are performing best this year are the ones grounded in that full picture, not the ones chasing last year’s hottest market. Start your market analysis on Mashvisor to pull all five of these data points for any city or property you’re considering.
FAQ
What’s the most important thing to check before buying an Airbnb property in 2026?
Supply growth relative to demand growth in the specific submarket matters most right now. A city can have decent overall tourism numbers and still be a poor investment if new listings have grown faster than bookings, which is exactly what happened in cities like Austin and Dallas over the past year.
Is a 50% occupancy rate bad for an Airbnb in 2026?
Not necessarily. National occupancy sits around 50%, but that number varies enormously by market and season. A 50% occupancy rate paired with a strong average daily rate can outperform a 70% occupancy rate at a low nightly rate, so occupancy needs to be read alongside revenue, not on its own.
How do I know if an Airbnb market is oversupplied?
Compare the growth rate of active listings in that market against the growth rate of occupancy or bookings over the same period. If listings are growing 25% or more year over year while occupancy is flat or declining, that market is showing oversupply signals.
Should I compare short-term and long-term rental income before buying?
Yes, and this is a step a lot of investors skip. Running both scenarios on the same property using the same data tells you which strategy actually has room to perform in that specific market, rather than assuming the short-term option is automatically better.
Do short-term rental regulations really affect investment decisions that much?
They can significantly change your return, and in some cases make a purchase illegal for its intended use. Registration requirements, nightly caps, and occupancy taxes have all increased in various cities over the past two years, so checking current rules for the specific property is a required step, not an optional one.
What tools do investors use to analyze an Airbnb market?
AirDNA, Rabbu, and Mashvisor are the most commonly used platforms. AirDNA and Rabbu are strong for isolated short-term rental performance data, while Mashvisor is built to combine that data with long-term rental comps and cap rate for the same property, which matters if you want to compare both strategies before you buy.