


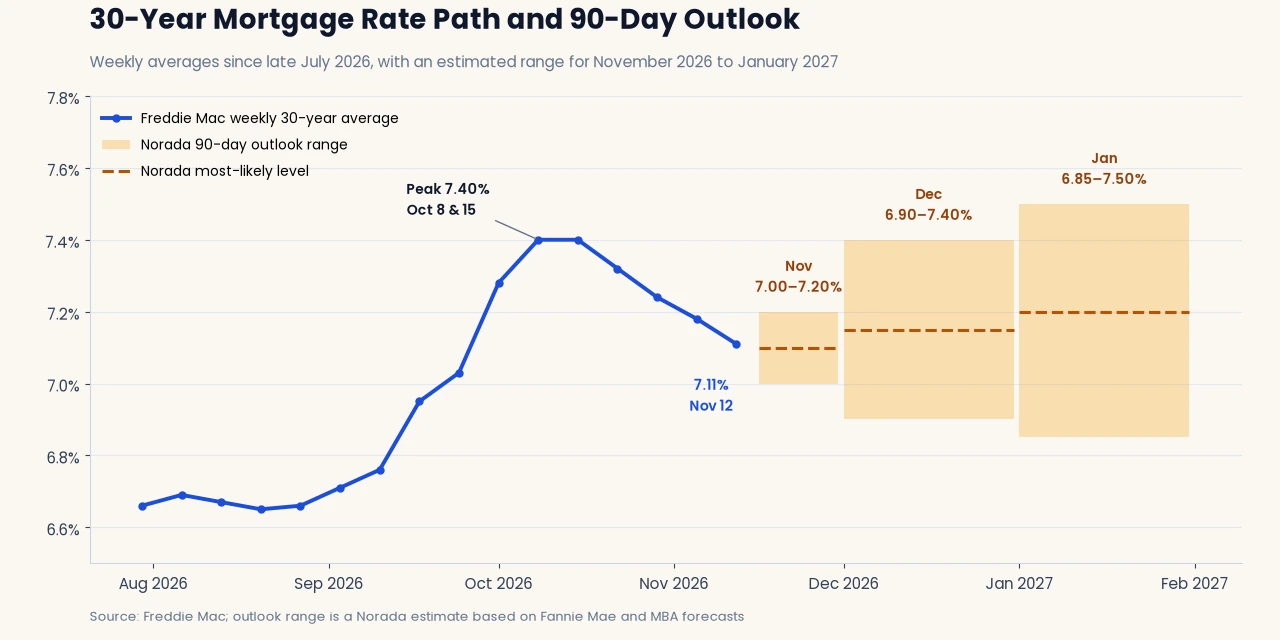
Here is the short answer: mortgage rates are likely to stay close to 7% over the next 90 days, from mid-November 2026 through January 2027. They have eased for four straight weeks, but the big forecasters still expect the 30-year fixed rate to sit in the low-to-mid 7% range into early next year. My own estimate puts the most likely path around 7.1% to 7.2%, with a realistic range of about 6.85% to 7.50%. In plain words, small moves are likely. A big drop is not.
Mortgage Rates Forecast for Next 90 Days: November to January 2027
If you are shopping for a home or thinking about a refinance this winter, the next three months matter. The holidays, a Federal Reserve meeting in December, a new year of inflation data and the January Fed meeting all land inside this window. Let me walk you through where rates stand, what the experts expect, and how I see each month playing out.
Where Mortgage Rates Stand Right Now
Freddie Mac reported that the average 30-year fixed rate was 7.11% for the week of November 12, 2026, down from 7.18% the week before. That makes four weekly declines in a row and the lowest reading in seven weeks. The 15-year fixed rate slipped to 6.45% from 6.57%.
For context, rates climbed fast this fall. The 30-year was about 6.66% at the end of July, jumped past 7% in late September, and peaked at 7.40% on October 8 and again on October 15. Since then, it has come down 29 basis points. A year ago, it was 6.24%, so borrowing is still clearly more expensive than it was last fall.

What Is Driving Rates This Winter
The 10-Year Treasury Yield
Mortgage rates tend to move with the 10-year Treasury yield. The U.S. Treasury shows that yield at 5.10% on November 12, up from 4.84% on November 5. That is a big jump in one week. By my math, the gap between the 30-year mortgage rate and the 10-year yield is now about 2.0 percentage points, which is on the narrow side. If the 10-year stays near 5.1%, it will be hard for mortgage rates to keep falling at the pace we saw in late October.
Inflation
The Bureau of Labor Statistics said consumer prices rose 0.4% in October after a 0.6% jump in September. Prices excluding food and energy rose 0.3% for the third month in a row. Those numbers are too warm for the Fed’s 2% goal. Lenders and bond investors watch them closely, and hot readings usually push rates up.
The Federal Reserve
At its October 27–28 meeting, the Federal Reserve kept its key rate in a range of 3.75% to 4.00%. The statement said inflation “remains elevated.” Two members voted against the decision because they wanted to raise rates by a quarter point. That tells you the Fed is not close to cutting. The Fed does not set mortgage rates directly, but its tone moves the bond market, and that moves your rate.
What the Experts Expect
Fannie Mae: Its October 2026 housing forecast expects the 30-year rate to average 7.4% in the fourth quarter of 2026 and 7.5% in every quarter of 2027. Keep in mind that Fannie Mae built those numbers from rates as of September 30, before the recent four-week decline.
Mortgage Bankers Association: The MBA’s October 11 forecast calls for an average of 7.3% in the fourth quarter of 2026 and 7.2% in the first quarter of 2027. The MBA expects rates to stay above 7% through 2027.
| Forecaster | Q4 2026 | Q1 2027 | Forecast Date |
|---|---|---|---|
| Fannie Mae | 7.4% | 7.5% | October 12, 2026 |
| MBA | 7.3% | 7.2% | October 11, 2026 |
| Freddie Mac (actual, Nov 12) | 7.11% | November 12, 2026 | |
Source: Fannie Mae, MBA and Freddie Mac
Here is a quick reality check I ran. Freddie Mac’s weekly readings averaged about 7.33% in October. If November averages near 7.1%, December would need to average about 7.45% for the fourth quarter to hit MBA’s 7.3%, and about 7.75% to hit Fannie Mae’s 7.4%. Both look high to me given where rates are today. So I expect the actual fourth-quarter average to come in a bit below both forecasts, unless inflation surprises to the upside.
My Month-by-Month Outlook
The ranges below are my own estimates, built from the Fannie Mae and MBA forecasts, the current Freddie Mac level and the recent move in Treasury yields. They are not official forecasts from any agency.
| Month | Likely Range (30-Year Fixed) | Most Likely Level | Key Events |
|---|---|---|---|
| Rest of November 2026 | 7.00% to 7.20% | About 7.10% | Thanksgiving week; light data |
| December 2026 | 6.90% to 7.40% | About 7.15% | Jobs report Dec 4; CPI Dec 10; Fed meeting Dec 8–9 |
| January 2027 | 6.85% to 7.50% | About 7.20% | Jobs report Jan 8; CPI Jan 13; Fed meeting Jan 26–27 |
Source: Norada estimates
Late November: Holding Near 7.1%
The rest of November is usually quiet. Thanksgiving week brings thin trading and few big reports. After a four-week slide, I think rates mostly hold their ground here, give or take a few basis points. The jump in the 10-year yield on November 12 makes another big weekly drop less likely.
December: The Fed and Inflation Take Center Stage
December is the busiest month in this window. The November jobs report comes out on December 4. The Fed meets December 8–9, and that meeting includes new economic projections from Fed officials. Then the November inflation report lands on December 10. A cooler inflation reading could pull rates toward 6.9%. A hot one, or a Fed that sounds ready to hike, could send them back toward 7.4%. That is why the December range is wider.
January: A Fresh Year, Same Questions
January opens with the December jobs report on January 8 and the December inflation report on January 13. The Fed meets again January 26–27. Both big forecasters expect rates in the 7.2% to 7.5% range early in 2027, which is why my most likely level edges up a little to about 7.2%. The range is widest here because three months out is simply harder to call.
What These Rates Mean for Your Payment
Let’s put numbers on it. On a $333,360 loan, which is 20% down on October’s $416,700 median home price from the National Association of Realtors, here is the monthly principal and interest on a 30-year fixed loan:
- 6.85% (low end of my January range): about $2,184
- 7.11% (today’s Freddie Mac average): about $2,243
- 7.20% (my January most-likely level): about $2,263
- 7.50% (high end, and Fannie Mae’s 2027 forecast): about $2,331
So the whole range from best case to worst case is about $147 a month. Between today and my most likely January level, the difference is only about $20 a month. That is why I would not plan a purchase around guessing the exact week rates bottom out.
Risks That Could Change This Outlook
- Rates could fall faster if inflation cools sharply in the December and January reports, the job market weakens, or bond investors rush to safety.
- Rates could rise faster if inflation stays hot, the Fed signals a rate hike, energy prices jump again, or the 10-year yield keeps climbing past 5.1%.
- The spread matters too. The gap between mortgage rates and Treasury yields is fairly narrow right now. If it widens, mortgage rates could rise even if Treasury yields hold steady.
What Buyers and Homeowners Should Do Now
If you are buying in the next 30 to 60 days: rates are well below the October peak. If you find a home and a payment that works, a rate lock makes sense. Ask your lender about lock length, since the holidays can slow closings, and ask whether a float-down option is available.
If you are buying in the spring: use this window to get ready. Check your credit, pay down card balances and save for closing costs. A stronger profile can lower your rate more than market timing can.
If you are thinking about refinancing: a refinance usually makes sense only if you can cut your rate by a meaningful amount and stay in the home long enough to recover the closing costs. Most homeowners with rates below 6% have no reason to refinance at 7%.
The Bottom Line for the Next 90 Days
Mortgage rates have cooled from their October peak, and that gives buyers a little breathing room heading into the holidays. But with inflation still warm, the 10-year yield above 5% and a Fed in no hurry to cut, I expect the 30-year fixed rate to stay roughly between 6.85% and 7.50% through January 2027, most likely around 7.1% to 7.2%. Plan your budget around today’s rate, keep an eye on the December 8–9 Fed meeting and the inflation reports, and use the calculator below to see what your own payment could look like.
Estimate Your Monthly Mortgage Payment
Estimates only. Your actual payment depends on your lender, taxes and insurance.
Estimated Monthly Payment
$0
- Principal & Interest$0
- Property Tax$0
- Home Insurance$0
- PMI$0
- HOA$0
$0Loan Amount
$0Total Interest
$0Total Cost of Loan
Read More:
Explore these related articles for even more insights: