


A household needs to earn about $110,000 a year to comfortably afford the typical U.S. home in 2026. That’s roughly $22,000 more than what the typical household actually brings in. If the numbers haven’t been adding up for you, you’re not imagining it. But the gap is slowly getting smaller, and where you live changes the answer more than almost anything else.
Here’s the simple idea behind that number. A home is usually called “affordable” when the monthly payment (mortgage, property taxes and insurance) takes no more than about 30% of your gross income. Home prices have barely moved over the past year, but mortgage rates climbed back above 7% this fall, and that pushes the income you need even higher. Below, I’ll walk you through the latest numbers, what it takes in different cities, and smart ways to close the gap.
How Much Do You Need to Earn to Afford a House in 2026?
The Income Needed for a Typical U.S. Home
According to Redfin’s latest affordability report, Americans need to earn $109,796 a year to afford the typical U.S. home for sale. That figure is for June 2026, the latest month in the report, and it’s down just 0.5% from the all-time high of $110,382 a year earlier. Redfin assumes a 15% down payment and calls a home affordable when the monthly payment takes no more than 30% of income.
Redfin estimates the typical household earned $87,599 at that point. That leaves a gap of $22,197. Here’s the good news: a year ago, the gap was $26,125, and two years ago it was $28,834. Incomes are simply growing a little faster than housing costs.
Two more numbers from the same report stand out:
- Share of listings you can afford: Just over one-third (34.2%) of U.S. home listings were affordable to a median earner in June, up from 30.5% a year earlier.
- Starter homes: You need about $70,693 to afford a typical entry-level home, down 1.5% from a year ago.
What the Typical Household Actually Earns
For the official income number, I always go to the U.S. Census Bureau. In its report released on Sept. 15, 2026, the Census Bureau said median household income was $87,460 in 2025. That’s up 2.6% from $85,210 in 2024, and it’s the highest on record going back to 1967.
One small but important detail: that figure covers the full calendar year 2025. It’s the newest official number available. Redfin’s $87,599 is its own estimate for June 2026, the month its report covers, which is why the two are close but not identical. Either way, the typical household comes up about $22,000 short of what it takes to buy the typical home comfortably.
What a Typical Home Costs Right Now
There’s no single “official” home price. Here are three national numbers I trust, all for September 2026:
- National Association of Realtors: The median existing-home price was $417,500, up 1.3% from $412,300 a year earlier, according to the latest existing-home sales report. That’s the 39th month in a row of yearly price gains.
- Zillow: The typical U.S. home value was $366,913, up 1% from a year earlier, according to Zillow’s September market report.
- Redfin: The median sale price was $393,895, up 1.3% year over year.
NAR tracks the homes that actually sold, while Zillow estimates what a middle-of-the-market home is worth. So the typical American home costs somewhere between about $367,000 and $418,000 right now, and prices are only inching up.
Why Mortgage Rates Matter So Much
Here’s the part that really moves the math. According to Freddie Mac, the average 30-year fixed rate was 7.32% on Oct. 22, 2026. That’s down a bit from 7.40% the week before, but way up from 6.19% a year ago.
Think of the mortgage rate as the price tag on the loan itself. When the rate goes up, so does your monthly payment, and so does the income you need. Redfin’s $109,796 figure was based on June, when rates were in the mid-6% range. Rates have climbed above 7% since then, and higher rates on their own push the income needed up.
NAR Chief Economist Lawrence Yun put it plainly: “Further increases in mortgage rates in recent weeks mean fewer buyers can qualify to purchase a home.”
Buying vs. Affording: The Two Rules That Matter
When people ask how much they need to earn, they’re usually asking one of two different questions. And the answers aren’t the same.
| What Lenders Allow (Buying) | What’s Comfortable (Affording) | |
|---|---|---|
| The Rule | 36% to 43% of gross income for all monthly debts (debt-to-income, or DTI) | 28% to 30% of gross income for housing alone |
| What It Counts | Your housing payment plus car loans, student loans and credit cards | Mortgage, property taxes, insurance and any HOA dues |
| The Question | Can I get approved for this loan? | Can I pay this every month without stress? |
Just because a bank says yes doesn’t mean your budget will. Your job is to find the payment that still leaves room for groceries, savings and retirement.
What That Looks Like on a Median Income
Let’s use the Census figure of $87,460. That works out to about $7,288 a month before taxes. Here’s what each rule allows for a monthly payment:
- 28% rule: about $2,041 a month for housing
- 30% rule: about $2,187 a month for housing
- 36% DTI: about $2,624 a month for all debts combined
- 43% DTI: about $3,134 a month for all debts combined
See the difference? A lender might be fine with a payment over $3,000 if you have no other debts. But the comfortable zone is closer to $2,000 to $2,200.
How Much You Need to Earn in Different Cities
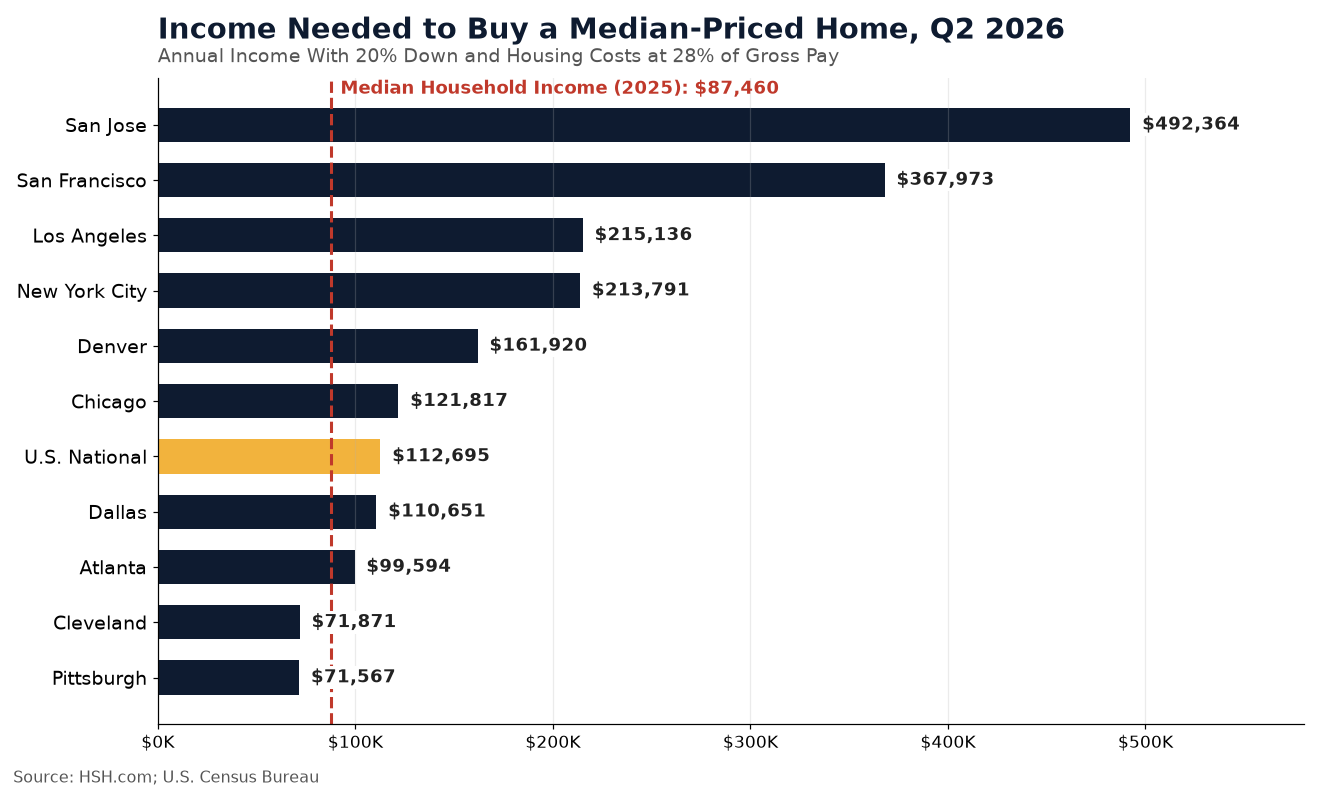
National numbers hide how wild this gets by location. HSH.com calculates the income needed to buy a median-priced existing home in the 50 largest metro areas. Its second-quarter 2026 numbers assume 20% down, housing costs of 28% of gross income and an average 30-year rate of 6.41% (6.66% in San Francisco and San Jose, where jumbo loans are the norm). Nationally, buying a $434,900 home took $112,695 a year.

Here’s how a few big metros compare:
- San Jose, CA: $492,364
- New York City, NY: $213,791
- Chicago, IL: $121,817
- Dallas, TX: $110,651
- Pittsburgh, PA: $71,567
Redfin’s metro numbers differ because it uses its own price data, 15% down and a 30% limit, but the story is the same. Redfin found just three major metros where the typical household earns more than it needs to buy a home: St. Louis, Indianapolis and Pittsburgh.
Practical Ways to Close the Gap
If you’re short of the magic number, here’s what I’d look at first:
- Start smaller. A starter home needs far less income than the typical home. Redfin’s $70,693 figure is below the typical household income.
- Put more down if you can. A bigger down payment means a smaller loan. HSH.com figures the national income needed jumps to about $129,678 with only 10% down, partly because of private mortgage insurance.
- Pay down other debts. Lower car or credit card payments improve your DTI and leave more breathing room.
- Shop more than one lender. Even a small rate difference changes your payment.
- Look at nearby, cheaper areas. Moving your search a bit can cut the income you need by tens of thousands of dollars.
- Use your negotiating power. NAR counted 1.60 million homes for sale in September, a 4.8-month supply. Sellers are more open to price cuts and credits.
So, Can You Afford a House in 2026?
YES, it may make sense to buy if: your household earns close to or above the income needed in your area, your housing payment would stay near 28% to 30% of your gross pay, you have savings left over after closing, and you plan to stay put for at least five years.
It may be smarter to WAIT if: the payment would push you well past 30%, you’d drain your emergency fund to make it happen, or your job or plans feel shaky right now.
My take: the “right” income isn’t one magic number. It’s the number that lets you sleep at night. Run your budget with today’s rates, talk to a couple of lenders, and pick a payment you can handle even in a tight month. The gap between income and home prices has been shrinking for two years now, and a little patience and planning can go a long way.
Read More:
Explore these related articles for even more insights: