



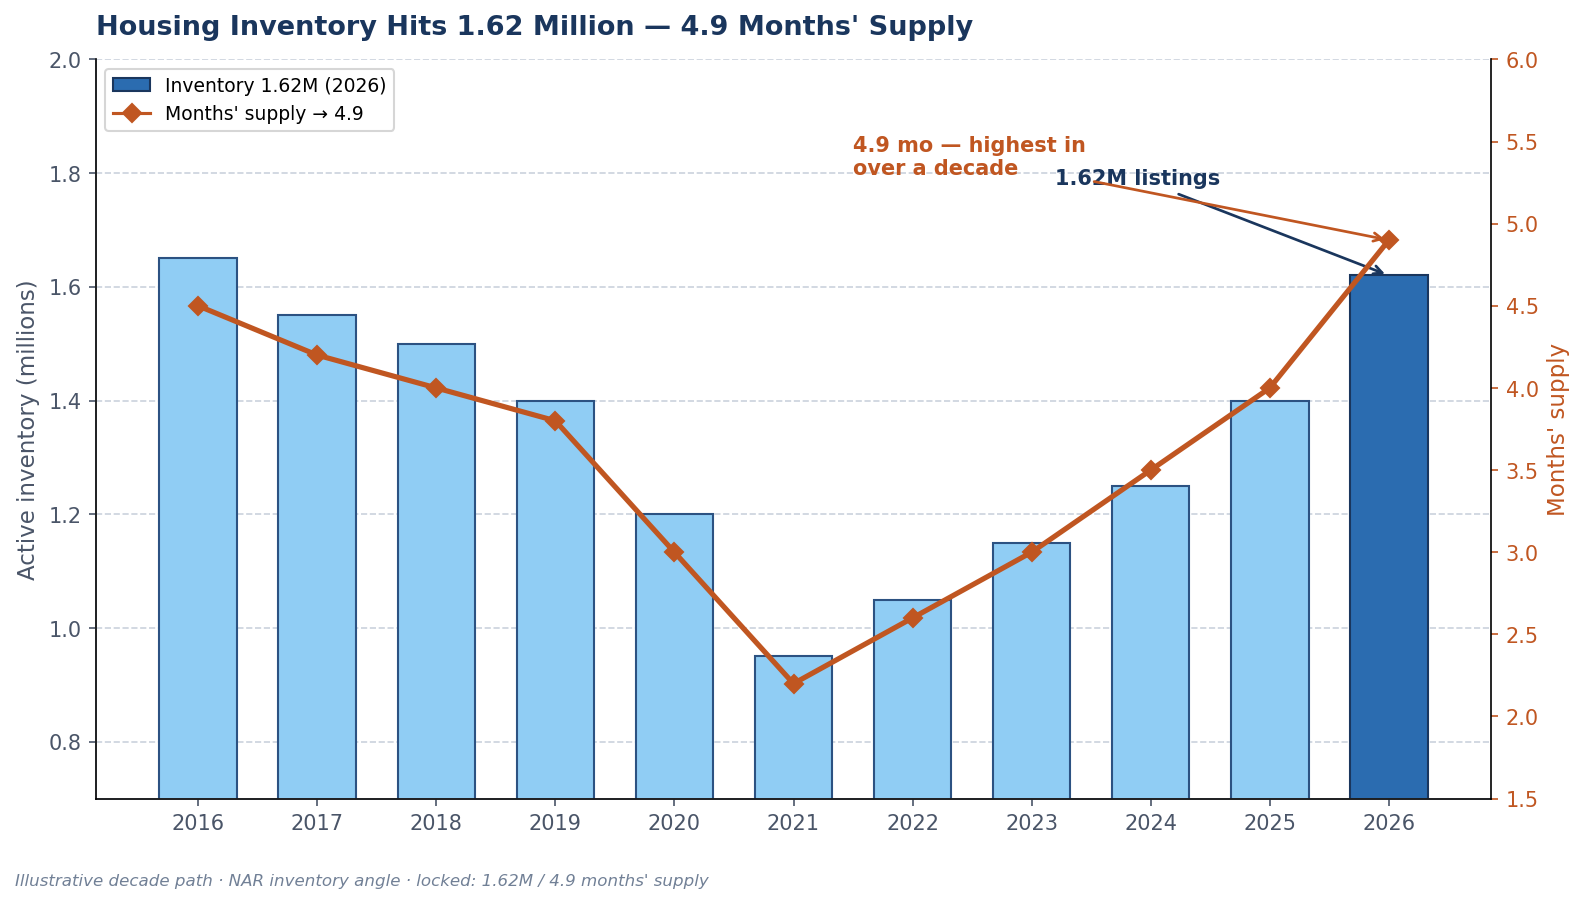
U.S. housing inventory has climbed to about 1.62 million homes for sale — roughly 4.9 months’ supply — the highest supply cushion in over a decade. That is not a nationwide glut, and it is not 2008 redux. It is a meaningful thaw from the years when buyers saw three showings and a Sunday deadline.
More listings are meeting softer demand while 30-year mortgage rates sit near 7% and the Fed’s funds rate sits at 3.75%–4.00% after a unanimous +25 bp hike under Chair Kevin Warsh, with an SEP median near ~4.1% for end-2026. The result is a market that finally offers choice in more places — and asks sellers to earn their price. Pair this with existing-home sales at a 14-month low and buyer negotiating power this fall for the full picture.
Housing Inventory Hits 1.62 Million Homes — 4.9 Months’ Supply, Highest in Over a Decade
Inventory and Months’ Supply, Without the Jargon Fog
Active inventory is the count of homes listed and available. Months’ supply estimates how long that stock would last if sales continued at the recent pace and no new listings arrived. Around five to six months is a common national rule of thumb for a loosely “balanced” market. Readings well below that tend to favor sellers; readings well above tend to favor buyers.
At about 4.9 months, the national tape is approaching balance — a big psychological shift after years when many reports showed much thinner cushions. “Highest in over a decade” describes that supply relief relative to recent history. It does not claim every metro is oversupplied. Coastal job magnets and land-constrained cities can still feel tight while broader suburban and Sun Belt pockets look plentiful.
- Active inventory: ~1.62 million homes
- Months’ supply: ~4.9
- Context: highest in over a decade (national framing)
- Demand backdrop: existing sales soft near 3.98M SAAR; purchase apps weak
- Rate backdrop: 30-year fixed surveys ~7.00%–7.08%; some quotes higher

Why Listings Rose Even With Rate Lock-In
Two forces pull opposite directions. Lock-in keeps many owners from listing because their current mortgage rate sits far below today’s near-7% quotes. Selling would mean giving up a cheap payment and financing the next home at a much higher coupon. That bottleneck is real.
At the same time, life does not pause for the Fed. Job changes, divorces, estate settlements, and growing households still push homes onto the market. Some investors exit. When the sales pace slows faster than listings arrive — as we have seen with softer closings — months’ supply rises even if the absolute listing count is only moderately higher. That is the arithmetic behind a 4.9-month read.
New Construction Adds Choice (and Competition)
Builders sitting on finished specs often compete by offering incentives rather than waiting forever for a full-price retail buyer. That feeds measured inventory and changes the competitive set for resale sellers. Soft builder sentiment — an HMI of 32, a 12-month low — and widespread incentives are part of the same story. See builder sentiment at 32 and incentives and price cuts in September.
What 4.9 Months Changes on the Ground
When supply was extremely thin, waiving inspection and appraisal contingencies felt normal in hot pockets. With nearly five months of supply nationally, that extreme behavior looks less rational in many neighborhoods. Buyers can see more homes before writing, ask for repairs or credits without automatic rejection, compare new-build packages against resale, and walk away from overpriced listings that sit.
None of that means every seller is desperate. Many still have equity cushions and can wait. The shift is about margins and probabilities: more deals involve conversation; fewer deals are take-it-or-leave-it theater.
| Market gauge | Recent national read | Bias |
|---|---|---|
| Inventory | ~1.62M | More choice than pandemic-era lows |
| Months’ supply | ~4.9 | Near balanced; not a fire sale |
| Existing sales | ~3.98M SAAR (14-month low) | Absorption still sluggish |
| Mortgage rates | ~7% territory | Keeps many buyers on the sideline |
| Fed funds / SEP | 3.75%–4.00%; median ~4.1% end-2026 | Policy not racing toward cheap credit |
Sellers: Price Into Supply, Not Nostalgia
If your home hits the market beside a dozen similar listings, the first two weeks matter more than a year-old appraisal story. Overpricing into ~4.9 months’ supply often means stale days on market — and stale listings invite lowball offers. A cleaner approach:
- Price at a clearing level supported by the last 60–90 days of comps, including failed listings.
- Make the home easy to say yes to — repairs, cleanliness, flexible showing windows.
- Pre-approve which concessions you will trade for certainty (credits, buydown help, closing timeline).
- Track competing new construction incentives the way a listing agent should track resale comps.
- Disclose insurance and HOA realities early; escrow surprises kill deals late (home insurance costs and the real monthly payment).
Remember carrying costs. Two extra months of mortgage, taxes, insurance, and utilities can erase the “win” from holding out for a fantasy full-price offer.
Buyers: Choice Is Not the Same as Cheap
More inventory improves your options; it does not guarantee a dramatic haircut. The practical win is often structure — seller-paid points, closing-cost credits, repair concessions, rent-back flexibility, or a temporary buydown — especially when a seller’s pride sticks to the list price.
- Track list-to-sale ratios and days on market in your micro-market, not only national charts.
- Tour new construction and resale the same weekend so incentive packages become real numbers.
- Stress-test the payment at today’s rate, not a hoped-for refinance six months out.
- Keep financing and inspection contingencies unless you truly face a multiple-offer exception.
- If early payment relief helps, ask about temporary 2-1 buydowns.
Also compare loan channels. Depending on credit, down payment, and occupancy, FHA or VA pricing versus conventional can change what you can afford inside the same listing set.
Investors: Underwrite Absorption, Not Just Cap Rates
For rental buyers, 4.9 months’ supply is a reminder to model exit liquidity and time-on-market, not only in-place rent. Soft existing sales can mean longer resale timelines if you need to dispose of an asset in the same rate regime. Pair that with financing near 7% and selective builder discounting, and disciplined bids matter more than narrative macro calls about a “crash” or a sudden boom.
Watch local permitting and builder phase delays too. Soft sentiment today can mean thinner deliveries later — which eventually supports rents and resale scarcity again. Timing horizons differ; your underwriting should say which horizon you are buying.
Regional Nuance Still Rules
National inventory is a helpful headline and a blunt instrument. Insurance-stressed coastal counties, overbuilt outer suburbs, and job-rich infill neighborhoods can tell three different stories in the same month. Migration, remote-work patterns, and local employment still shape whether 4.9 months feels balanced or heavy on your street.
If you are relocating across states, budget time for a real shopping window. The gift of higher supply is the ability to compare — but only if you do not recreate artificial urgency for yourself.
How Inventory Connects to Rates and the Fed
The Fed does not set your 30-year mortgage one-for-one, yet a unanimous hike and a year-end SEP near ~4.1% reinforce that cheap credit is not the base case for the next few months. Expensive financing slows absorption; slower absorption lifts months’ supply. That feedback loop is why inventory relief and rate pain often arrive together. For the pre-hike rate spike itself, see why mortgages hit 7% before the Fed moved.
Bottom Line
1.62 million homes and about 4.9 months’ supply mark the most balanced national inventory backdrop in over a decade — arriving while rates remain expensive and policy has tightened to 3.75%–4.00%. That is a better shopping environment for patient buyers and a stricter grading curve for sellers. Translate the national thaw into neighborhood strategy with local MLS data, honest pricing, and a full payment worksheet that includes insurance and HOA — then negotiate like the market you actually have.
🏡 High‑Yield Midwest Rentals: Missouri vs Indiana
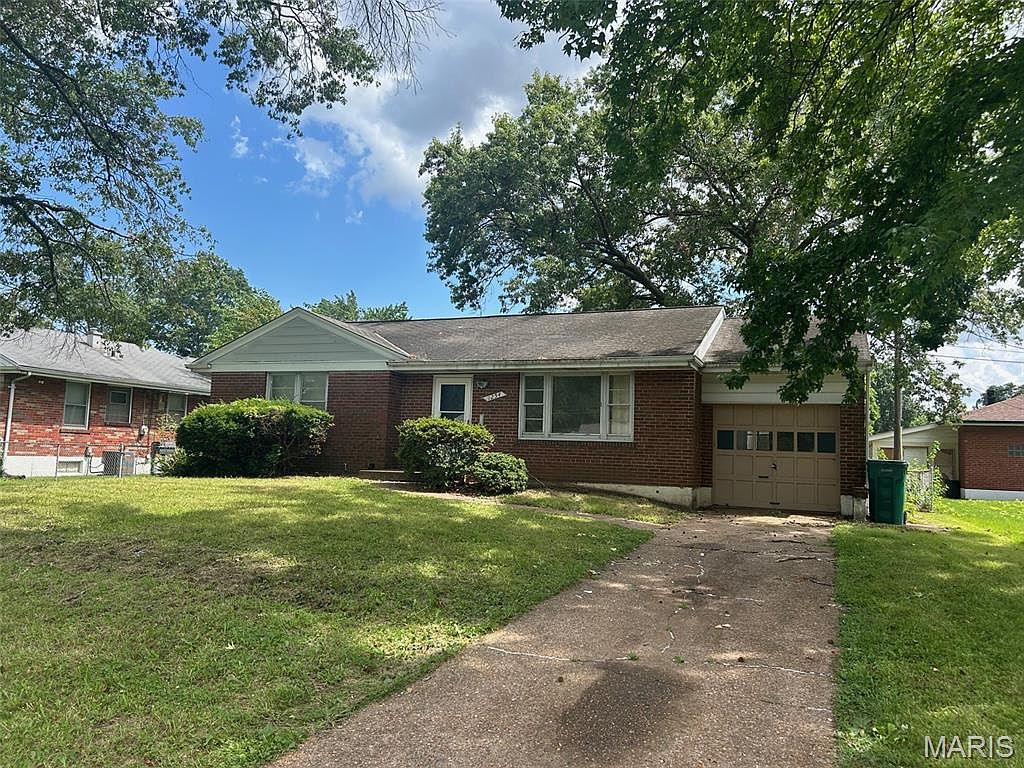
Saint Louis, MO
🏠 Property: Waldorf Dr
🛏️ Beds/Baths: 4 Bed • 1 Bath • 1192 sqft
💰 Price: $145,000 | Rent: $1,500
📊 Cap Rate: 8.7% | NOI: $1,051
📅 Year Built: 1961
📐 Price/Sq Ft: $122
🏙️ Neighborhood: B+

Indianapolis, IN
🏠 Property: E Raymond St
🛏️ Beds/Baths: 2 Bed • 1 Bath • 968 sqft
💰 Price: $192,000 | Rent: $1,550
📊 Cap Rate: 7.4% | NOI: $1,179
📅 Year Built: 1904
📐 Price/Sq Ft: $199
🏙️ Neighborhood: B
Saint Louis offers a budget‑friendly 4‑bed rental with a high cap rate, while Indianapolis provides a classic 2‑bed property with steady cash flow. Which Midwest market fits YOUR investment strategy?
We have much more inventory available than what you see on our website – Let us know about your requirement.
📈 Choose Your Winner & Contact Us Today!
Speak to a Norada Investment Counselor (No Obligation):
(800) 611-3060