



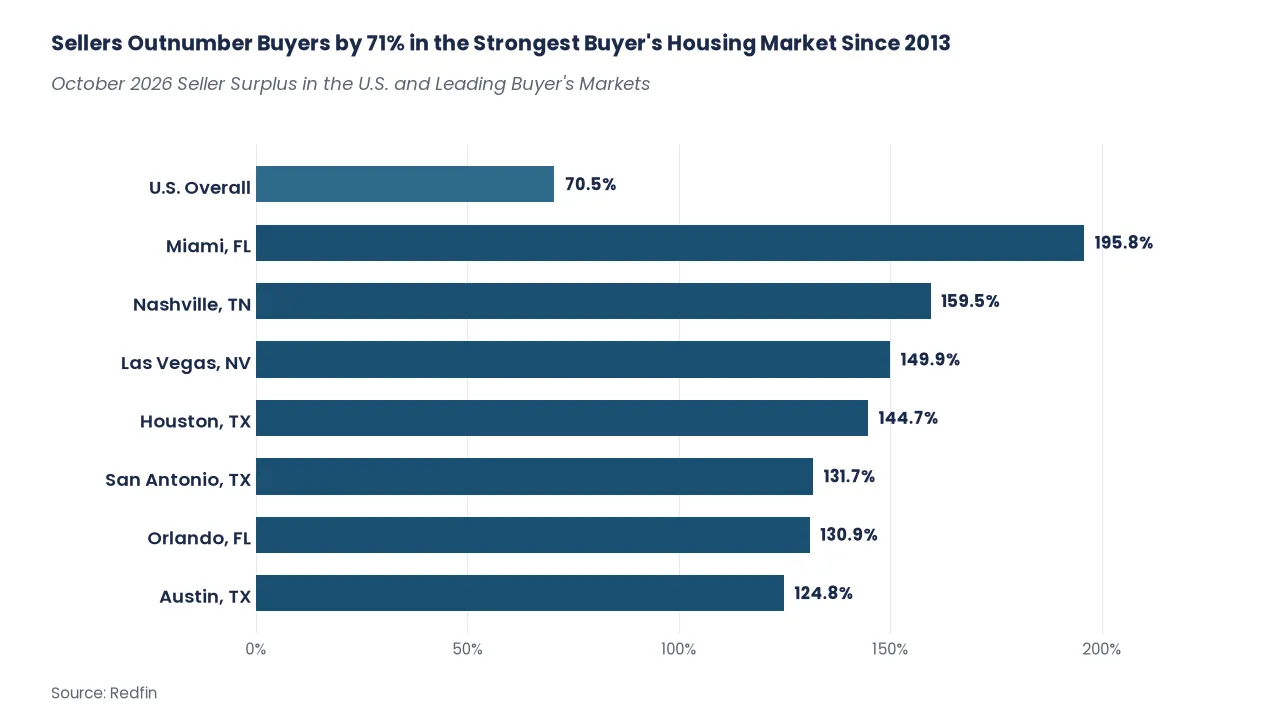
Sellers now outnumber buyers by 71% in the U.S. housing market, the widest gap in Redfin’s records going back to 2013. In October, 41 of the 50 largest metro areas were buyer’s markets, and only three still favored sellers. If you can comfortably afford today’s costs, you have more room to negotiate than at any point in at least 13 years. The hard part is the payment. The 30-year mortgage rate is still 7.18%, which is one reason so many shoppers have stepped back.
Sellers Outnumber Buyers by 71% in the Strongest Buyer’s Housing Market Since 2013

Source: Redfin.
Redfin published the October figures on November 12, 2026. The firm’s more precise national estimate is 70.5% more sellers than buyers, which it rounds to 71% in its summary. That is the sixth straight month the gap has set a new record, and it is up from 65.6% in September. Redfin estimates there were 895,752 homebuyers nationwide in October, the lowest level in records dating back to 2013, and down 2% from September, the sixth monthly decline in a row. On the other side, there were an estimated 1,526,984 sellers, the most since March 2020, and up 0.9% from the month before.
When sellers outnumber buyers, buyers usually have more choices and more room to ask for a better price or help with closing costs. Redfin calls it a buyer’s market when there are more than 10% more sellers than buyers, and a seller’s market when there are more than 10% fewer sellers than buyers. A gap within 10% either way is a balanced market.
Redfin’s buyer and seller counts are seasonally adjusted estimates and can be revised.
Why the Buyer-Seller Gap Widened in October
The gap grew because buyers pulled back faster than sellers did. Mortgage rates averaged 7.33% in October, up from 6.86% in September, which priced out more shoppers. Today’s mortgage rates list the 30-year fixed purchase rate at 7.18% on Sunday, November 22, 2026. That is a little below the October average, but it is still high enough to weigh on the monthly payment.
Homes are also lingering. Each month, new listings add to a pool of houses that have already been sitting without going under contract. Some owners are listing anyway because they have stopped waiting for lower rates, worry prices could fall, or need to move. Many others have plenty of equity and little pressure, so they may keep waiting.
High housing costs and economic jitters have pushed many would-be buyers to the sidelines, and that is a big reason the gap looks so wide. The same caution showed up in contracts: pending home sales fell 16.7% from a year earlier in October, to a record low, as mortgage rates stayed high.
Just Three Major Metros Still Favor Sellers
Seller’s markets are now the exception. Only three of the 50 most populous U.S. metro areas favored sellers in October, tied for the fewest in Redfin’s records dating back to 2016 and matching April 2020, when the pandemic froze the housing market.
All three are in the Northeast. Nassau County, New York, was the strongest seller’s market, with 24.7% fewer sellers than buyers. Newark, New Jersey, had 14.3% fewer. Montgomery County, Pennsylvania, had 12.1% fewer. All three gaps shrank from September, when Nassau County was at 28.3%, Newark at 17.6%, and Montgomery County at 20.1%. Milwaukee, a seller’s market in September, is now balanced.
Limited homebuilding has kept supply tight in these pockets. In the greater New York City area, that tight supply meets strong demand for homes near a major job center, so buyers are still competing. Home-sale prices rose an average of 3.3% year over year across the three seller’s markets in October, compared with a 0.3% increase across the buyer’s markets.
“Buyers looking in these pockets of the Northeast should be prepared for a very different experience than buyers elsewhere in the country,” said Redfin Senior Economist Asad Khan. “They may have less room to negotiate, especially on desirable, move-in-ready homes, and could face multiple-offer situations. If you’re shopping in one of these markets, it’s especially important to know your budget, be ready to act when the right home comes along and avoid getting swept up in a bidding war.”
Where Buyers Have the Most Negotiating Power
More than 80% of the metros Redfin analyzed, 41 of 50, are buyer’s markets, matching September’s record. For the third month in a row, Miami and Nashville had the biggest seller surpluses. Miami had 195.8% more sellers than buyers in October. Nashville had 159.5% more. Las Vegas was third, at 149.9%. In the top 13 buyer’s markets, there were more than twice as many sellers as buyers. Nearly all are in the Sun Belt, including four in Texas and four in Florida.
Builders in those states have kept adding homes even as demand has cooled, which has swelled inventory and given shoppers more options. In Florida, higher HOA fees and homeowners insurance costs have made the squeeze even tighter.
The seller surplus grew from September to October in 34 of the 41 buyer’s markets. The biggest jump was in Miami, where the surplus rose from 160.5% to 195.8%. Las Vegas rose from 122.8% to 149.9%, and Nashville rose from 134.3% to 159.5%.
Buyers lost a little negotiating power in seven buyer’s markets, including Fort Worth, where the surplus slipped from 100% to 91.6%; St. Louis, from 27.1% to 23.1%; Austin, from 128.2% to 124.8%; and Dallas, from 120.5% to 118.6%. Jacksonville, Pittsburgh, and Los Angeles also saw the surplus shrink, but all seven remain buyer’s markets.
Six Large Metros Are Still Balanced
Six metros were balanced in October, meaning they did not clearly favor buyers or sellers. Chicago had 8.1% more sellers than buyers. Boston and Providence, Rhode Island, each had 7.5% more. New Brunswick, New Jersey, had 5.6% more. Milwaukee had 0.6% fewer sellers than buyers. San Francisco had 6.9% fewer. In these cities, do not assume every seller will cut the price, and do not assume you will face a bidding war. It depends on the house.
What This Means If You Are Buying
A buyer’s market helps only if you can afford the home. “A buyer-friendly market can help make homeownership a little more attainable, even if it doesn’t solve the affordability challenges that have kept many people on the sidelines,” Khan said. “Sellers are increasingly competing for buyers’ attention, which can translate into price reductions, concessions and other savings.”
That is showing up in prices, too. New home prices fell 4.2% in the third quarter, leaving a $39,600 gap versus typical resale homes. If you are touring new construction and existing homes, compare the full monthly payment at today’s 7.18% rate, including taxes and insurance, not just the list price.
Khan also noted that first-time buyers do not have equity from a previous home, which makes the down payment harder, but they also do not have to sell a house first or give up a low mortgage rate. “With a historic buyer’s market and home prices that are finally ticking down after three years of increases, first-time buyers who have been waiting—and can afford today’s costs—may have an opportunity to make a move,” he said. It may be worth a close look if you can carry the payment at 7.18%, not a teaser rate, and plan to stay long enough to “date the rate and marry the house.” That means you buy the home you can afford now, and refinance later if rates fall. You may want to wait if the payment only works when you stretch every month, or if you expect to move again in a few years.
What This Means If You Are Selling
If you are selling, you are competing for a smaller pool of buyers. Price the home to the market in front of you. A listing that comes out too high can sit while similar homes nearby cut the price or offer closing-cost help. This is not a reason to panic, but it is a reason to be realistic. My take is that this is a real shift in bargaining power, not a free pass. The 71% gap is the widest since at least 2013, and the payment at 7.18% is real, too. Use the calculator below to run the numbers on a home you are considering before you make an offer.
Estimate Your Monthly Mortgage Payment
- Principal & interest$0
- Property tax$0
- Home insurance$0
- PMI$0
- HOA fees$0
$0Loan amount
$0Total interest
$0Total of payments
Yearly amortization schedule
| Year | Principal | Interest | Balance |
|---|
Estimates only. Your actual payment depends on your lender, taxes and insurance. PMI applies only when the down payment is under 20%.